Uncategorized files
Jump to navigation
Jump to search
Showing below up to 50 results in range #51 to #100.
 Button link.png 23 × 22; 434 bytes
 CM Figure 25-1053 v1.2.png 701 × 515; 224 KB
 CM Table 25-1054 v1.3.png 835 × 720; 284 KB
 CM section Figure1.jpg 1,280 × 720; 145 KB
 CM section Figure2.jpg 1,280 × 720; 79 KB
 CR Wiki Placeholder 3.png 750 × 431; 60 KB
 CSER 2025 6080x3890 Thumbnail-scaled.jpg 1,186 × 436; 162 KB
 CSlogo.png 600 × 216; 51 KB
 Caltech LOGO-Orange RGB.200.png 200 × 200; 8 KB
 Caltech LOGO-Orange RGB.png 1,486 × 360; 38 KB
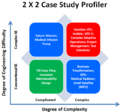 Casestudies-2x2.png 617 × 574; 32 KB
 Cecilia-haskins.jpg 113 × 150; 8 KB
 Chap4 fig 1 new.jpg 439 × 261; 28 KB
 Chap4 fig 1 new.png 1,871 × 1,138; 146 KB
 Chap4 fig 1 new Layer 1.png 439 × 261; 12 KB
 Chemical Interactions, Phenomena, Principles.png 461 × 134; 68 KB
 ChoeKimFigure1.png 747 × 331; 44 KB
 ChoeKimFigure2.png 841 × 107; 21 KB
 ChoeKimFigure3.png 983 × 277; 32 KB
 ChoeKimFigure4.png 723 × 396; 106 KB
 ChoeKimFigure5.png 506 × 361; 81 KB
 ChoeKimTABLE1.png 1,069 × 620; 45 KB
 Chris profile picture ESEP.png 1,200 × 900; 978 KB
 Cihan Dagli.png 193 × 185; 43 KB
 Circumplex Model of Group Tasks.PNG 626 × 470; 62 KB
 Circumplex Model of Group Tasks.png 626 × 470; 62 KB
 Clif baldwin editors bio photo.jpg 1,439 × 1,798; 362 KB
 Clifton Baldwin.jpg 360 × 360; 24 KB
 Cm change control process.png 529 × 427; 53 KB
 Cm functions.png 411 × 460; 83 KB
 Collaboration Across Key SE Standards and References.png 1,410 × 797; 414 KB
 Comparisons of life cycle models.PNG 1,038 × 931; 248 KB
 Component Lifecycle (rev a) - MJB ver2.jpg 2,079 × 250; 263 KB
 Composition of Leading Indicator-Figure 2.png 964 × 721; 269 KB
 Concept map for businesses and enterprises topics.png 960 × 720; 68 KB
 Core SEBoK Concepts.PNG 620 × 391; 92 KB
 Cost Estimation Figure 1.png 2,900 × 1,364; 256 KB
 Cost Estimation Figure 2.png 1,590 × 603; 116 KB
 Cost Estimation Figure 3.png 1,370 × 825; 94 KB
 Culture competence team performance and individual competence.png 960 × 720; 60 KB
 DEI Figure1.png 591 × 472; 85 KB
 DEI Figure2.png 591 × 518; 214 KB
 Dan DeLaurentis.jpg 360 × 360; 22 KB
 DaveOlwell.jpg 1,400 × 2,100; 1.19 MB
 David Endler.png 242 × 209; 85 KB
 David Endler 2.jpg 240 × 289; 10 KB
 Decision Mgt Process DM.png 703 × 694; 624 KB
 Decision selection flowchart.png 1,364 × 869; 257 KB
 Decision tree example.png 565 × 380; 54 KB
 Decomposition of Functions AF 071112(2).png 1,134 × 750; 128 KB


.png)
_-_MJB_ver2.jpg)